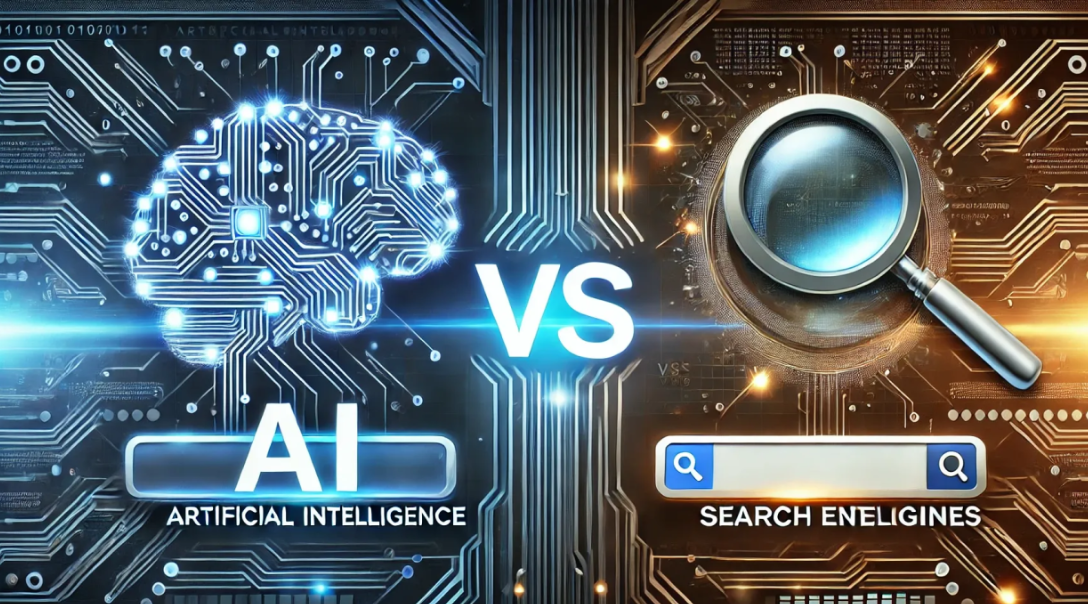
In a world overflowing with information, grabbing and holding someone’s attention is harder than ever. Whether you’re educating an audience, promoting a message, or explaining data, you need formats that make complex ideas easy to digest. That’s why infographics have become such a vital part of modern communication.
Infographics take dense content—numbers, processes, comparisons, timelines—and turn them into visual stories that humans can understand quickly. Instead of expecting people to wade through paragraphs of text, infographics guide the eye with visual cues, color, and layout. They make meaning instantly clear and memorable.
Thanks to advances in creative tools, anyone can now create professional, engaging visual content without expensive software or years of design experience. One example is the infographic maker, a platform that helps turn ideas, data, and insights into polished visuals in minutes.
The Science Behind Why Infographics Work
Our brains are wired to process visuals faster than text. About 90% of information transmitted to the brain is visual, and visuals are processed 60,000 times faster than text. That’s a big part of why infographics are so effective—they align with how we naturally understand the world.
When people see an infographic, they don’t have to decode long descriptions. Instead they recognize patterns, relationships, and key points at a glance. This speeds understanding and makes information feel more approachable and less overwhelming.
Infographics also leverage visual memory. People are more likely to remember images paired with information than standalone text. That’s a huge advantage when you want your message to stick.
Where Infographics Make the Biggest Impact
Infographics aren’t tied to one industry. Their versatility means they work well in many contexts:
Education and Learning
Students and educators use infographics to break down concepts, visualize processes, and summarize lessons. Visual learning helps reinforce retention and makes complex ideas easier to revisit.
Marketing and Social Sharing
In a crowded digital landscape, visual content stands out. Infographics on social media and blogs drive engagement because they are easily shareable and instantly informative.
Business Reporting
From internal dashboards to stakeholder presentations, infographics make data-driven decisions clearer. They turn raw numbers into visual narratives that teams can act on.
Blogging and SEO
Infographics enhance written content by improving readability and increasing time on page. They can also attract backlinks when others reference your visuals in their content.
Key Elements of an Effective Infographic
Not all infographics are equally effective. The best ones share several key characteristics:
A Clear Focus
Every infographic should have a central idea. Trying to convey too many concepts at once dilutes the message and creates confusion.
Engaging Visual Hierarchy
Size, color, and placement should guide the viewer’s eye from the most important information to supporting details. Headings, icons, and charts help establish this flow.
Accurate, Reliable Data
Design can elevate content, but it can’t save poor information. Strong infographics are grounded in solid research and reliable sources.
Consistent Design
Colors, fonts, and styles should align with your brand or topic. Consistency builds trust and professionalism.
Whitespace and Balance
Letting content breathe improves readability. Cluttered visuals are harder to interpret, so balance is key.
Practical Tips for Creating Better Infographics
Creating an impactful infographic doesn’t require perfection — it requires clarity. Here are some actionable tips:
- Start with the story first. Outline what you want to communicate before designing.
- Keep text concise. Infographics are visual summaries, not essays.
- Use color strategically. Highlight key points without overwhelming the viewer.
- Choose readable fonts. Prioritize clarity over decorative design.
- Test different layouts. Sometimes flipping the sequence or adjusting spacing improves understanding dramatically.
Infographics should feel intuitive — viewers shouldn’t have to guess what they’re looking at.
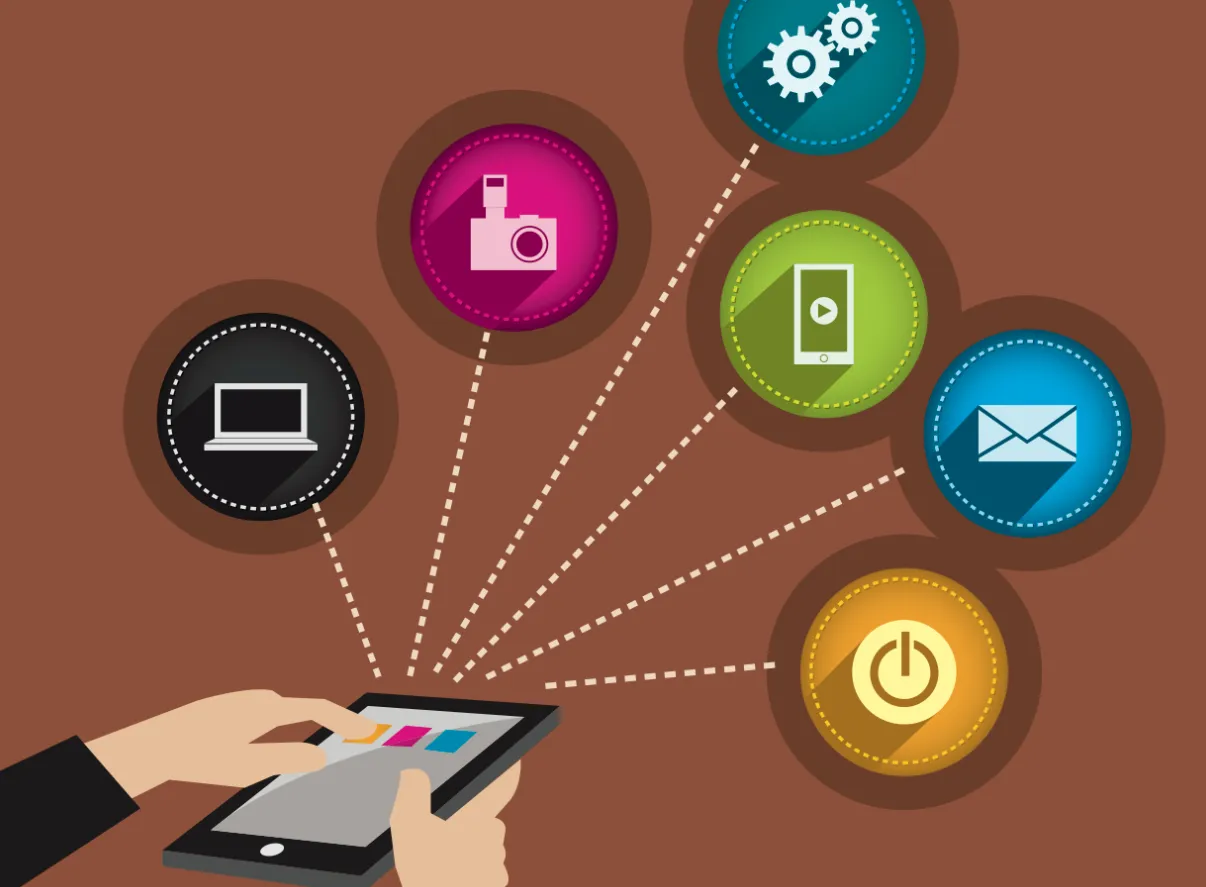
Making Infographics Faster and Easier with Today’s Tools
Modern design tools have fundamentally changed how infographics are made. What once required professional software and design experience is now accessible to anyone. Tools like the one linked above provide:
- Templates for common structures (timelines, comparisons, data breakdowns)
- Customizable layouts and colors
- Drag-and-drop simplicity
- Instant previews and edits
This democratization of design means that visual literacy—the ability to communicate through visuals—is no longer limited to trained designers. Anyone with a message can visually articulate it effectively.
Why Visual Content Is the Future of Communication
People aren’t slowing down — but our capacity to process text-heavy content has its limits. Visual communication gives audiences a way to absorb, understand, and remember information quickly. It respects their time while still delivering depth.
Infographics sit at the intersection of data, design, and storytelling. They make information feel approachable and actionable — a combination that’s increasingly valuable in classrooms, boardrooms, and social feeds alike.
Conclusion: Turn Information Into Insight
In an era of endless information, clarity wins. Infographics help convert complexity into insight, making ideas accessible, engaging, and memorable.
Whether you’re educating, persuading, or updating an audience, visuals help your message land faster and stay longer. With the right approach and tools, turning information into meaningful visuals is no longer a hurdle — it’s an opportunity.